01Problem
Rehabilitation work on tidal-swamp farmland in Banyuasin is surveyed as spreadsheets of points per reach, with no hydraulic model. The canal studio expected HEC-RAS geometry, so none of it could be drawn automatically.
02What I built
A second input path for the studio: a written contract for survey sheets (embankments, canal normalisation, new tertiary canals), a checker that flags inconsistent sheets before anything is drawn, an embankment design step, and the studio's existing renderer for long sections, cross sections and a site plan.
03How it works
- A data contract. One sheet per reach, chainage written as “STA a+bb”, point codes starting from the canal side, E/N/Z coordinates, and flood parameters.
- Computed, never copied. Crest elevation = flood reference + maximum flood height + 0.50 m freeboard. Crest width 3 m, side slopes 1:1, volumes by average end area.
- A checker that speaks first. On the first real sheets it flagged 22 places where the distance along the axis disagreed with the chainage, a reach that doubles back on itself, and pairs of embankments only 12–15 m apart.
- Built beside, not inside. New modules on top of the canal studio, so the irrigation pipeline and its tests stay untouched.
04Results and scale
- 14 embankment reaches → 174 PDF sheets plus DXF for the first village.
- PDF gate at zero on all 29 output files; 29 DXF files audited with no errors; 16 new automated tests.
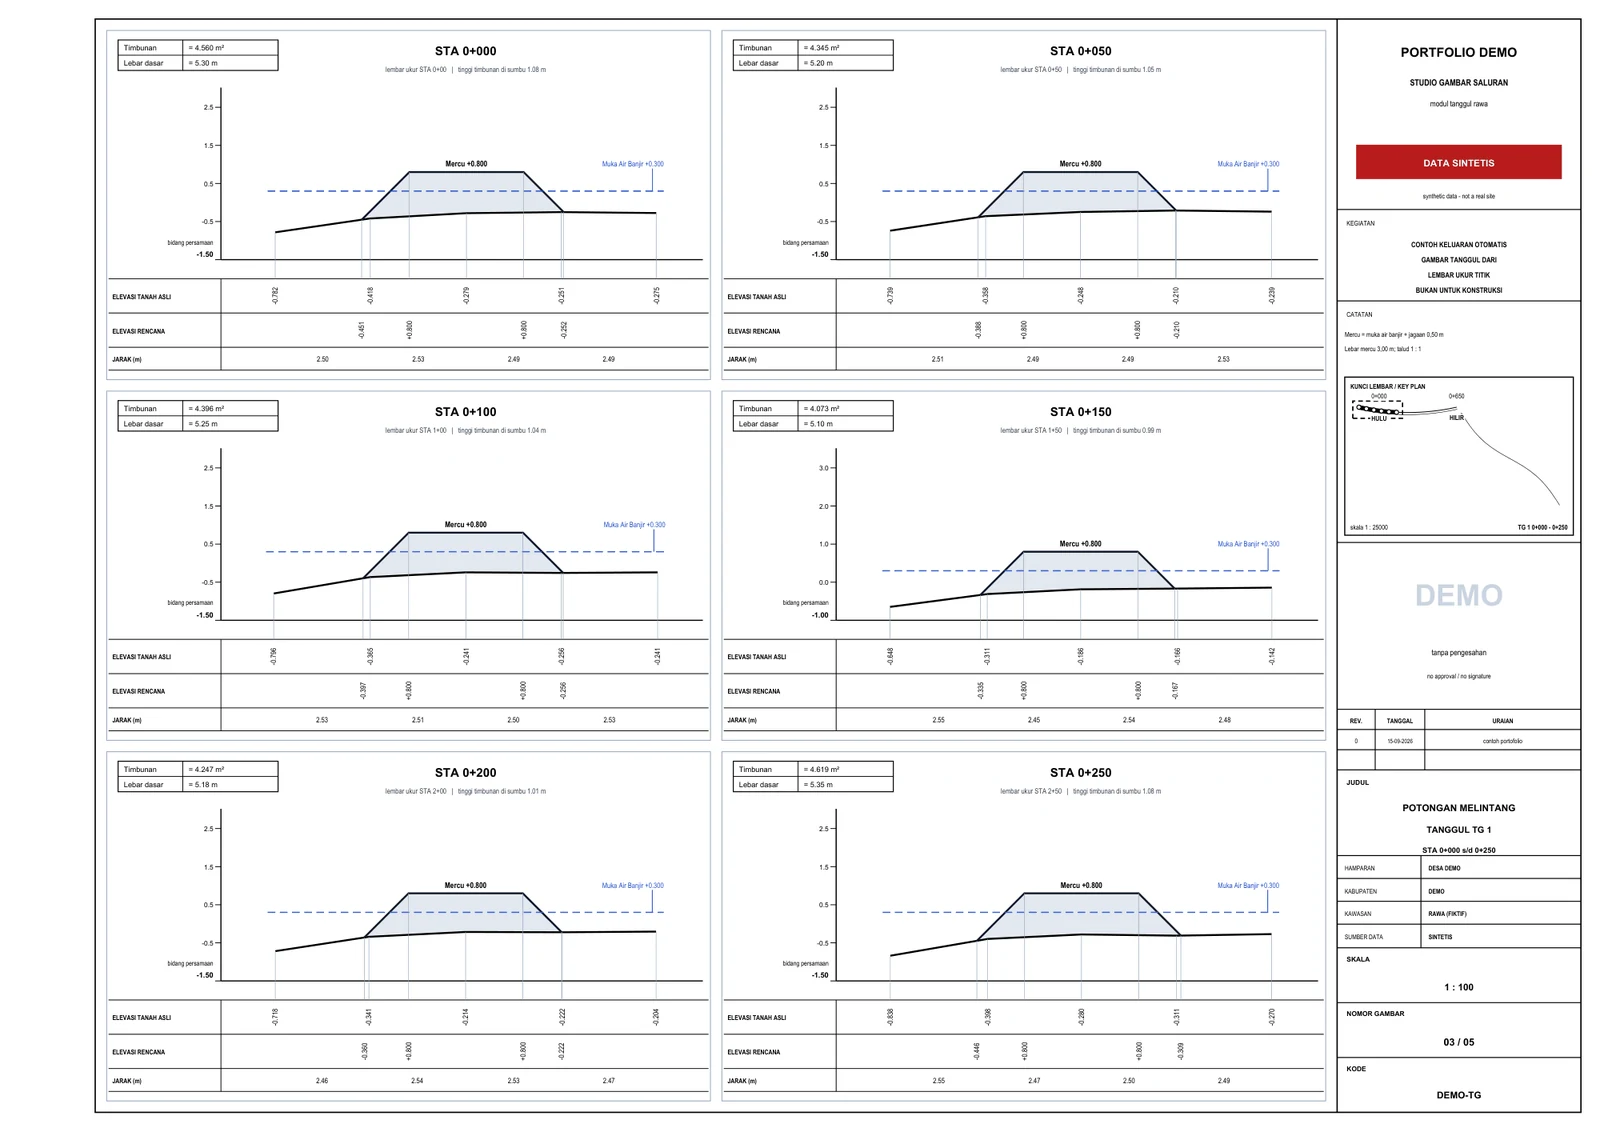
- The drawings shown here come from a synthetic survey sheet (three fictitious reaches) run through the same module; the demo set passed the same PDF gate with zero findings.
05Stack
- Python
- ezdxf
- reportlab
- pytest
06Gallery
Drawing labels are in Indonesian, as delivered. Coordinates in the demo are a fictitious local grid.