01Problem
A tertiary irrigation rehabilitation design covers dozens of blocks. Each one needs long and cross sections, earthwork quantities, a cost estimate, technical specifications and a final report. Whenever the hydraulic model or a field survey changes, everything downstream changes too — and figures copied by hand drift apart between the drawings, the estimate and the documents.
02What I built
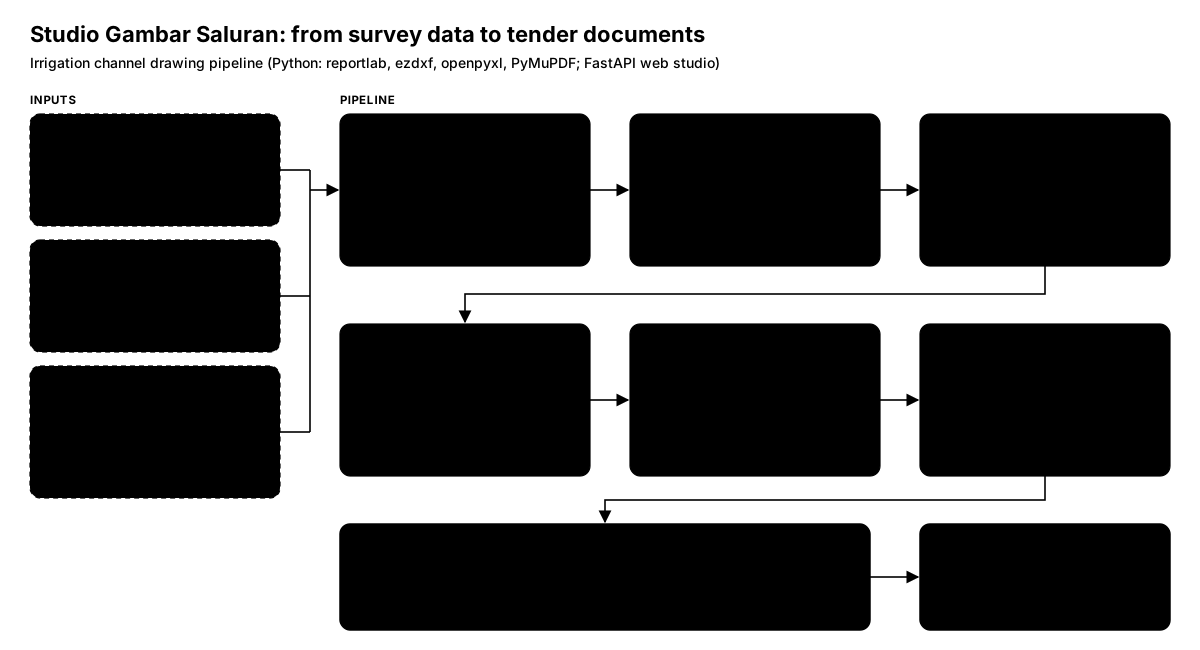
A web studio where the team uploads HEC-RAS geometry, a field-condition table and the canal alignment for each block. The server rebuilds the drawings, quantities and cost estimate, and the specifications and final reports are generated from those same computed numbers.
03How it works
- One folder per block. Geometry (
.gNN), field conditions (kondisi.csv), alignment (.kmz) and title-block data. If a block has more than one geometry file, the studio refuses to guess and asks for confirmation — guessing could draw design geometry as if it were existing ground. - Design criteria built in. Sections follow the Indonesian irrigation design criteria (KP-03 / KP-05); branched canals are supported.
- Drawings that open anywhere. A3 PDF sheets with the official title block, plus DXF files that open in AutoCAD.
- One source for money. The cost estimate is recalculated on the server (headless LibreOffice) from one master workbook per scheme; specifications read the computed values, not template cells.
- Release gates. More than 1,300 automated tests, and a PDF gate that measures overlapping text, text outside the frame and text crossing lines — all three must be zero. The last full sweep of 118 PDFs came back clean.
- Nothing silently lost. Uploads that replace a file back up the old version first; server data is snapshotted before any correction.
- Helpers for the team. Two one-click Windows tools print estimate workbooks to PDF and assemble document packages without installing Python.
04Results and scale
- In production for 72 tertiary blocks across 3 irrigation schemes in South Sumatra — about 3,390 ha, with roughly 109 km of canal and 555 gates in the cost estimates.
- Technical specifications for all 72 blocks generated from the recomputed estimates; per-block and per-scheme final reports are being produced from the same numbers.
- Gate schedule checked against 416 gate-structure drawings; gate prices rebuilt from an assembly-based unit-price analysis.
- More than 250 commits between 17 August and 14 September 2026.
- Origins: I started coding in 2024 — websites with WordPress and a few Python automations; a FastAPI web app and a headless section kernel followed in mid-2026, before this studio replaced them.
05Try it
Two small pieces of the pipeline, rebuilt in the browser on a fictitious 1.2 km canal: a cross-section viewer (existing ground, design section, water level, cut and fill) and the quantities-to-estimate recap. Change an earthwork quantity and every amount, subtotal and weight follows.
Cross-section viewer
Three surveyed stations of a fictitious earth canal: existing ground, the trapezoidal design section with small banks, the design water level, and the cut and fill between them.
Swipe sideways to see the whole chart.
Design basis (Manning, uniform flow): Q 0.45 m³/s · n 0.025 · S 0.0006 · b 0.80 m · side slope 1:1 · normal depth 0.639 m · V 0.489 m/s · Fr 0.235 · freeboard 0.40 m → design depth 1.05 m. Local datum; data fictitious.
Quantities → bill of quantities
A fictitious 1.2 km canal package. Earthwork quantities come from the cross-sections by average end area × length; edit them to see amounts, subtotals, weights and the total follow.
Swipe sideways to see every column.
| Code | Item | Unit | Quantity | Unit price | Amount | Weight |
|---|
Weights are what the S-curve uses. VAT shown at 11% for illustration. Nothing here comes from a real project.
06Stack
- Python
- FastAPI
- HEC-RAS geometry
- ezdxf
- reportlab
- PyMuPDF
- openpyxl
- LibreOffice (headless)
- python-docx
- Docker
- Coolify (VPS)
- pytest
07Gallery
The studio sits behind a team login and its outputs carry client title blocks, so it is not linked. The sheets on the swamp-embankment page were produced by the same renderer from synthetic data.